
NUSO 2011 Research Missions
Coal Mine Inspections
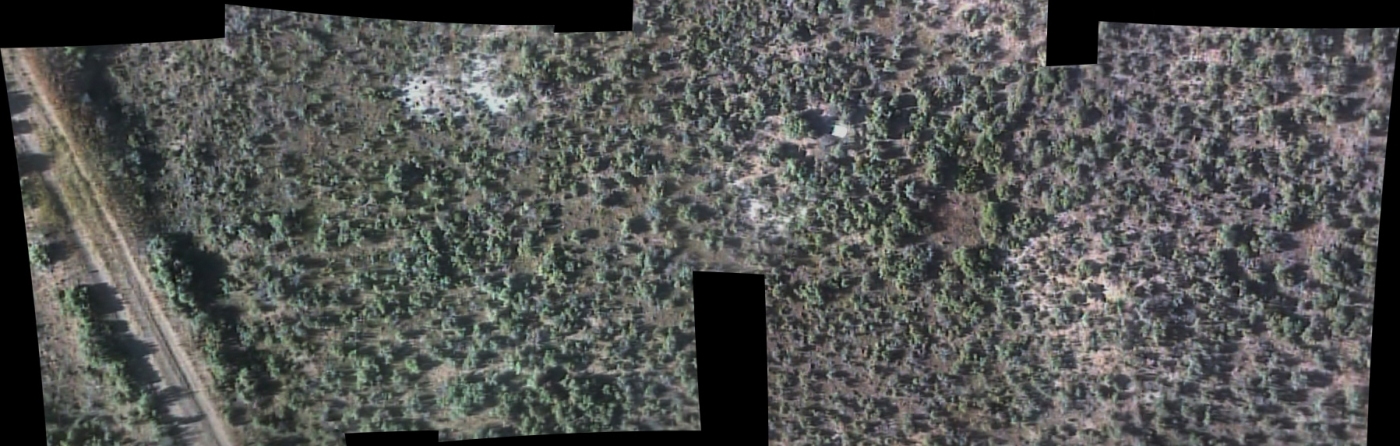
Contour Surface Coal Mines in West Virginia
Mine site inspections must be made to monitor a range of topics: water quality, hazardous conditions, terrain topology, wildlife habitats, post mining land use, and safeguarding cultural features. For instance, each coalmine is required to have installed drainage control structures internally and around the perimeter of each mine area to control runoff from the disturbed area and to prevent flooding. Verifying that is requirement is being met requires State and Federal inspectors to spend vast amounts of time, especially in areas like West Virginia that has over 1800 coalmines. In addition, West Virginia has many underground mine fires where very little information is known, sometimes even including the location and extent of the fire. However, to locate and inspect each of these would also require significant resources traversing rough terrain, which is hazardous to both the inspectors and their vehicles.
Three separate sUAS missions were performed by the USGS National Uncrewed Systems Office, in coordination with the Office of Surface Mining, at the Powellton Surface Mine during the 2011-2013 timeframe. The Powellton Surface Mine is a contour surface mine that has several miles of installed drainage/sediment ditches and two known underground mine fires, which made it an ideal location to test the utility of the sUAS sensors for supporting coal mining inspection and oversight. The first mission occurred in November 2011 using the Raven sensors to inspect the area, but the later missions, in 2012 and 2013, used the T-Hawk, which was the first operational use of this new technology. After its initial flight the T-Hawk quickly became the platform of choice based on its ability to hover and stare, and use of the higher resolution GoPro and Canon cameras for on-broad data capture. It was also much more mobile when flying in the tighter areas with steep terrain.
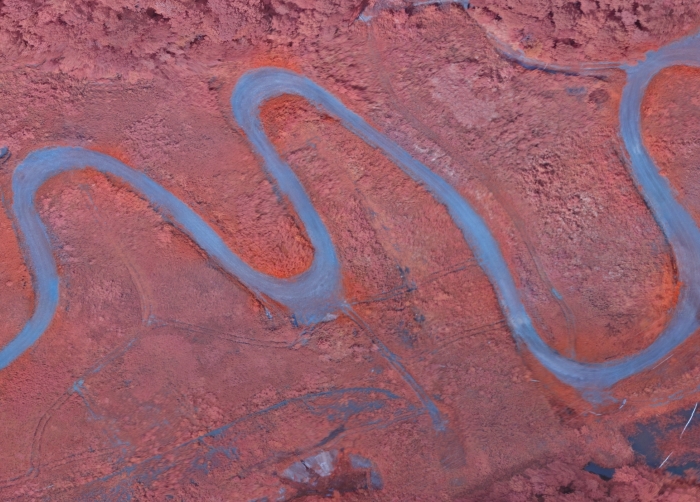
The data acquired during these missions included the video files from both the onboard camera systems and the stock video captured real-time during the flight missions, as well as the high resolution still frame images captured from both the Canon and the GoPro. Since visual inspection for compliance was the primary objective, images captured at oblique angles were determined to be as valuable as the vertical imagery. Either vertical or oblique imagery can be used for 3D modeling of the mining areas, as well as perimeter and volumetric measurements, through use of the photogrammetric post-processing software.
These successful missions at the West Virginia coalmines proved that sUAS technology was an efficient and unique new tool for surface mine inspection and monitoring. All of the data collected, from real-time video feeds, rectified imagery, and a video data collection for short- and long-term historical records, was shown to aid inspectors in monitoring the vast areas of surface mines they are responsible for overseeing annually. The imagery was also proven to be an effective method for capturing coal-seam fire locations and extent. It was also determined that valuable secondary products, such as 3D modeling, reclamation ground measurements, time-series investigations, color IR images for seep detection, and geo-rectified base images, could be derived from the low-altitude imagery.
Study Point of Contact:
Lukus J. Monette, Remote Sensing Specialist
U.S. Office of Surface Mining, Appalachian Regional Office
lmonette@osmre.gov
Monitor Shoreline Erosion
Missouri River on the Lower Brule Reservation in South Dakota
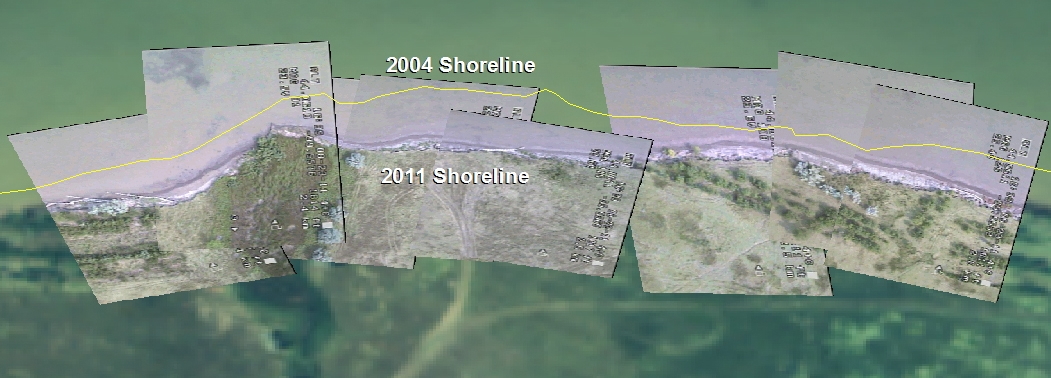
The Lower Brule Sioux Tribe (LBST), home to approximately 600 Native Americans, is located on the western side of the Missouri River in central South Dakota. The Missouri River and the two lakes formed by dams, Lake Sharpe and Lake Francis Case, form the northern and eastern boundary of the LBST Reservation which can see shoreline erosion occur at a rate of approximately 8 feet per year. This high rate of erosion threatens the many ancestral sites located along the Missouri River, as well as agriculture and recreational activities that are a large part of the LBST Reservation's economy. To better evaluate the impacts of this erosion the LBST Environmental Protection Office in South Dakota implemented a two year monitoring program of a study site that includes a 7-mile stretch of the Missouri River's shoreline that has experienced a high rate of bank loss, and the LBST rural water plant's intake location. However, direct shoreline access in this study area is hampered by the lack of roads, crumbling riverbanks and shallow water unsuitable for motorboat traffic. In an effort to potentially address accessibility concerns, the LBST Environmental Protection Office asked the USGS NUSO to determine if the Raven sensors could help monitor this shoreline.
During the missions in August of 2011 and 2012 the Raven was able to safely and easily access this remote shoreline by being hand launched from either land away from the shoreline, or a motorboat located offshore. The Raven successfully captured video imagery along the shoreline with its original FMV analog sensor, which was the only sUAS sensor available at this time. After completion of the Raven flights this relatively low-resolution video was used to capture data as still frame photography that was then geo-referenced with existing base imagery. Finally, the rectified images where mosaicked together to create a seamless shoreline image. This same process was used on the data acquired during the flights in 2012, resulting in two-years of rectified and oblique imagery over the same river bank erosion areas that could be used as a time-series of data collections to aid in land management decisions.
This successful mission not only demonstrated the benefits of this technology for acquiring data to help locate and analyze shoreline erosion, it also provided a safe and economical method for monitoring inaccessible or dangerous shoreline.
Study Point of Contact:
Kathy Neitzert, Hydrologist
SDWSC Huron Programs Office
kmneitze@usgs.gov
Publication:
Drones Across America, Discovery News article highlights USGS UAS Office and Lower Brule Sioux Tribe (LBST) Environmental Protection Office use of UAS technology to monitor Missouri River bank erosion. - August 2012.
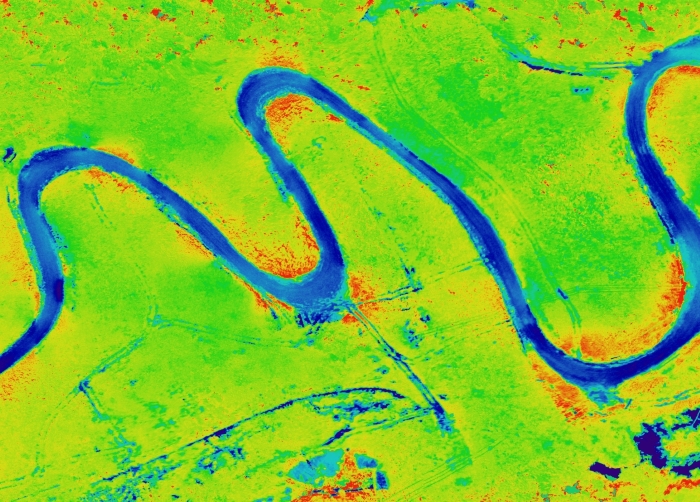
Ground Water Discharge Monitoring
Red Rock Lakes National Wildlife Refuge in Montana
Red Rock Lakes National Wildlife Refuge contains one of the few marshland wilderness areas in the country and is host to a population of rare trumpeter swans. Groundwater discharge to Upper and Lower Red Rock Lakes and the wetlands in between are a large component of the marshland water budget. However, the volume and distribution of groundwater discharge remain unknown, even though understanding the volume, distribution, and temporal variability of groundwater discharge is critical to management of the natural resources of this refuge and wilderness area.
In August 2011, USGS performed a sUAS mission to determine if the thermal sensors on a Raven could be used to identify areas of ground water discharge. Even though these thermal sensors are not calibrated, they could still be useful by showing relative temperature differences adequate for mapping the extents of the discharge areas within the lake water bodies or near the shoreline. This was based on the premise that since all discharge water is about 15 degrees C colder than the shallow lake water during mid to late summer, thermal IR imagery should be able to detect this temperature contrast. This would allow areas of focused groundwater discharge to be identified, after which detailed measurements of rates of discharge can be made, which will allow quantification of this focused groundwater discharge.
Evaluation of the thermal data acquired during this mission successfully identified several springs in the near-shore margins of Upper Red Rock Lake. Some of these springs discharged on land adjacent to the lake and then flowed overland into the lake, while others discharged in shallow water within several hundred meters of the shoreline. In addition, some of these springs were readily visible as distinct holes in the lakebed, whereas others were harder to identify.
Based on these evaluations it was determined that relative temperature differences, particularly in water bodies, are fairly easy to detect with sUAS thermal IR sensors making this technology a useful tool for mapping groundwater discharge point and distribution. Time-series studies can also be employed, through multiple collects over time, to display the perennial or intermittent nature of the flow.
Study Point of Contact:
Donald Rosenberry, Project Chief
National Research Program, Central Branch, U.S. Geological Survey
rosenber@usgs.gov
Pygmy Rabbit Habitat Study
Desert between Shoshone and Hailey, Idaho
In June and July 2011, the USGS National Uncrewed Systems Office partnered with Boise State University and the University of Idaho to determine if sUAS technology could help gather data on the landscape habitat of pygmy rabbits. Pygmy rabbits dig extensive burrow systems in areas with large sagebrush, particularly mature stands, and loss of habitat is a direct threat to the species. These rabbits are also an important food source for the many other animals in the area, with birds and other mammals being primary predators. However, the rabbit's habitat has become increasingly fragmented by development, agriculture, fire and rangeland "improvements", e.g. projects that replace big sagebrush with bunchgrasses.
The goal of this mission was to determine if the Raven sensors could be used to remotely sense the quality of vegetation cover (e.g., concealment and transparency), diet (e.g., nutrients and chemical defenses), and temperatures across the landscape, and to overlay these attributes with remotely sensed movement and habitat use by wildlife. This data could then be utilized to determine the fitness of pygmy rabbits, and potentially aid in land use decisions made by agencies for habitat conservation.
The successful execution of several low altitude Raven flights resulted in the capture of high-resolution EO data that was later used to produce a base layer of rectified imagery that could be used to successfully analyze pygmy rabbit habitats. This layer was then used to develop and field-test spatially explicit models (e.g., mixed spatial regression models and hierarchical Bayesian models) depicting how vegetation cover, diet quality, and temperatures influence habitat use by pygmy rabbits.
This represents a novel approach since it provides a multivariate, multi-scale empirical link between theoretical predictions of the effects and interactions of multiple environmental stressors on the functional responses by pygmy rabbits. Although this imagery layer is just one input into a much larger GIS model, it represents data that has not previously been possible to attain. Therefore use of the sUAS technology shows great promise in establishing new models that will aid in wildlife conservation. It was also determined that improvements in the sUAS sensors would significantly increase the value of this base layer.
Study Point of Contact:
Dr. Jennifer Forbey, Biology Professor
Boise State University
jenniferforbey@boisestate.edu
Sandhill Crane Population Estimates
Monte Vista National Wildlife Refuge in Colorado
The first operational sUAS mission performed by the USGS National Uncrewed Systems Office (USGS NUSO) occurred during March 2011 at the Monte Vista NWR near Monte Vista, Colorado. This mission was performed in cooperation with the U.S. Fish and Wildlife Service (USFWS) to study the feasibility of using the sensors on a sUAS, in this case a Raven, to survey Sandhill cranes. The USFWS, mandated by Migratory Bird rules and regulation, is responsible for performing periodic surveys of the Sandhill crane population. Sandhill cranes are migratory birds that travel from Texas to Idaho (or as far as Siberia) annually and the Monte Vista NWR serves as a major stopover point during migration, which makes it a perfect location for conducting an accurate population count. These surveys are traditionally conducted by using fixed-wing aircraft, which can place both birds and staff at risk of mid-air collisions, or time consuming ground-count methods, where biologists in the field attempt to visually enumerate the birds with sectional surveys. Although both of these methods do produce the required information, they also introduce both safety and cost concerns, which made this a perfect choice for a Raven proof of concept mission.
As part of the planning process for this first Raven mission, the USGS NUSO was responsible for establishing operational procedures for obtaining all of the required approvals, including the FAA COA and radio spectrum processes presented earlier in this document. Work on receiving an approved COA from the FAA started on July 9, 2010 and final approval was received six months later on December 27, 2010. Details in the approved COA required that all Raven flights remain below 400 feet AGL, within visual line of sight of authorized trained observers and occur between morning civil twilight to evening civil twilight. Determining whether or not the Raven sensor payload was capable of picking up the heat signature of the cranes in enough detail to allow biologists to obtain accurate counts was the main objective of this mission. Equally important was determining how the cranes would react to the Raven, especially since there were concerns that the cranes would see the Raven as an eagle, a major predator, and flush/fly away when it approached. To minimize any potential disruption to the cranes the plan was to fly the Raven at high altitudes or at night when the cranes were at roost. However these plans had to be revised when the approved COA included both altitude limitations and approval for only day flights. Based on these new requirements, and the fact that the vast majority of cranes depart the roost at or shortly after sunrise, flights were planned during the approximate 30-minute time frame between civil twilight and sunrise.
Safe completion of these flights clearly demonstrated that the Raven sUAS could be flown without disruption to the cranes, and that the sensor payloads could identify their heat signature. This left only the question of whether or not this data could be used to provide accurate population counts. In order to answer this final question population counts were first derived from the imagery captured by the Raven sensors. This was done by using mosaicking software to process the video into a single image of the complete roosting area. Next the easily identified heat signatures were counted and a Raven derived population count was established. This population count was then compared to a count established by the USFWS prior to the Raven mission during a ground-count to get an 'observed' population count, as well as to verify the location of the cranes within their roosting area. Results of this comparison between the ground based and UAS data derived population counts resulted in a 4.6% difference, which was determined to be acceptable.
These results established that utilizing sUAS to perform population counts for Sandhill cranes is both safe and cost effective, and produces accurate results. In fact Dave Sharp, a retired USFWS biologist who has been working with the Sandhill cranes for over 25 years, said "I was skeptical about this process at first, but it has exceeded my wildest expectations". When asked if Raven video could be used to validate their counts, another biologist said that it was the other way around: his count will be used to validate the Raven's - "the Raven found birds that we did not know were there." The Refuge Manager, Floyd Truetken, said "I would like Raven and the team to come back to my refuge next year and they can come and train anytime. I would definitely recommend them to other refuge managers and biologists." There was 100% agreement among the scientists that this technology will revolutionize the way wildlife counts and tracking are conducted in the future.
Successful completion of this first mission resulted in the USGS NUSO being given approval from the FAA to also perform night flights during later Raven missions. These additional flights, including night flights, were performed in November 2011, March 2012, and March 2013. Final results from all of these missions were used to establish that Raven imagery provides acceptable population counts without disruption to the cranes, especially when flown at night when the cranes are at rest in the roosting areas.
Execution of this sUAS mission cost just $2,645, compared to similar fixed wing manned aircraft surveys that cost $4,310 up to $35,000 if contracted privately. Resulting in the finding that utilizing sUAS to perform population counts for Sandhill cranes is both safe and cost effective, and produces accurate results.
Publications:
A Drone's-Eye View of Nature - New York Times (www.nytimes.com)
USGS Takes to the Sky - Earth Imaging Journal Article September/October 2011