
NUSO 2016 Research Missions
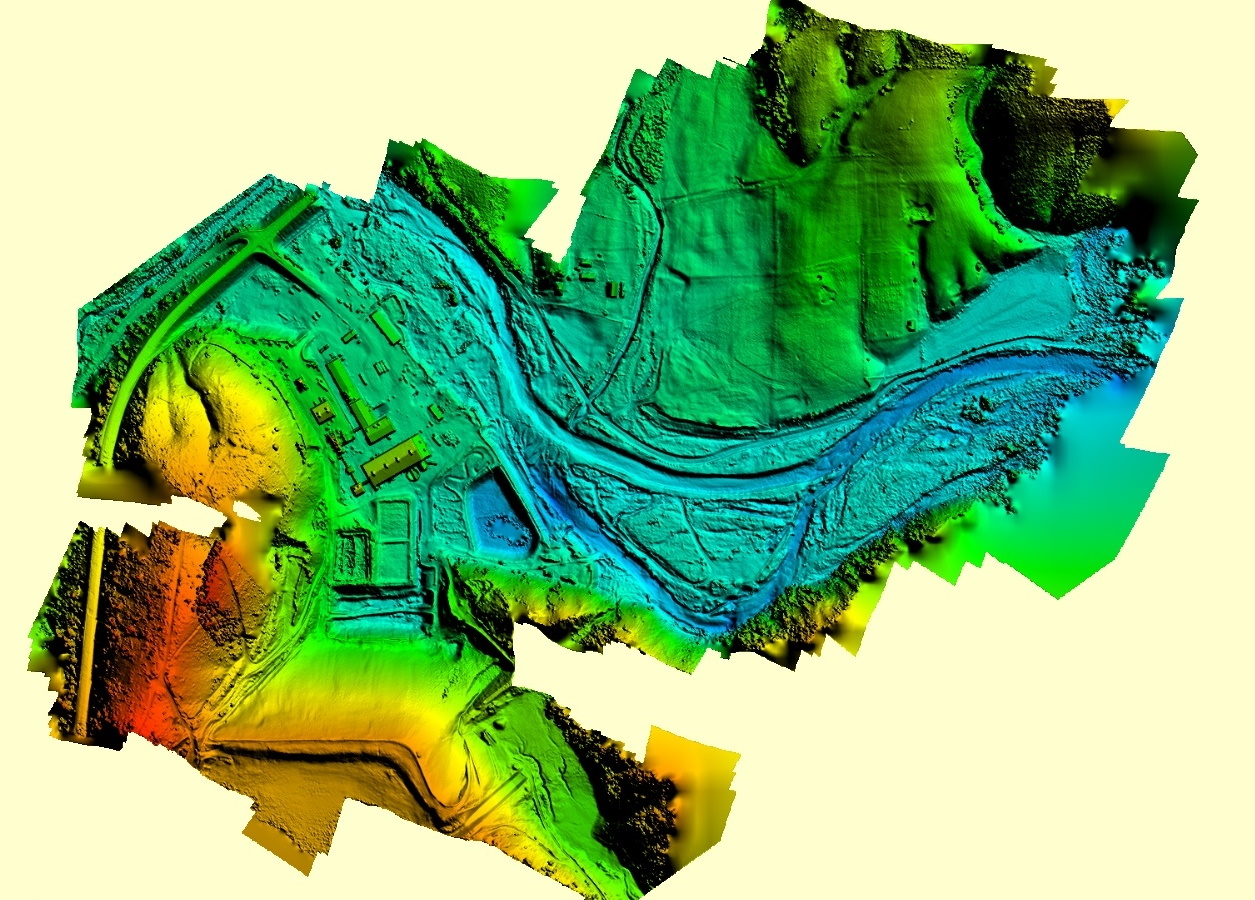
Reservoir Bathymetry During Drawdowns
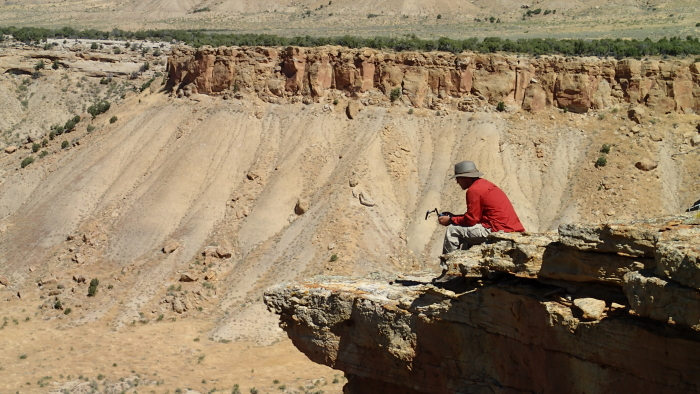
Fall Creek Lake in Oregon
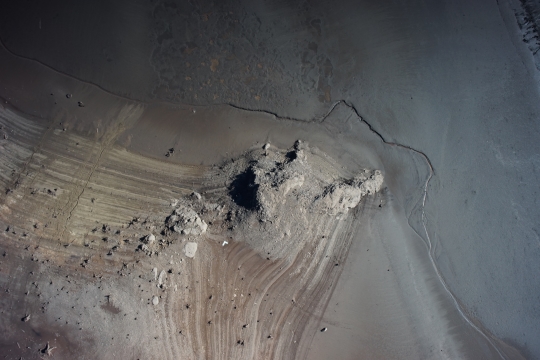
Retro-fitting high-head dams to enhance downstream passage of Endangered Species Act (ESA)-listed fish species is expensive, but a low-cost approach used at Fall Creek Lake in western Oregon entails a drawdown operation whereby lake levels are lowered so that downstream migrants can pass through the regulating outlet of the dam. Since 2011, annual drawdowns at Fall Creek Lake have yielded successful downstream passage, but have also liberated substantial volumes of sediment that have filled downstream side-channels and sloughs used by native fish with potential impacts to channel capacity in the stream reaches below Fall Creek dam. The US Army Corps of Engineers (USACE) hopes to minimize sediment impacts at Fall Creek and transfer this management strategy to other large dams in the Willamette Valley.
The USGS Oregon Water Science Center (ORWSC) is helping to support USACE with a research study that seeks to understand the processes and rates of reservoir erosion by evaluating changes in reservoir bathymetry using DEM differencing. DEM differencing would use the comparison of detailed DEMs produced from high-resolution imagery taken during yearly drawdowns to determine changes to the morphology of the reservoir bottom. Drawdowns are the period when lowering the reservoir level transforms the lake into a river-channel.
High-resolution imagery acquired during various drawdown periods is a crucial requirement to DEM differencing, but the ORWSC previously only had access to high-resolution LiDAR data collected during the 2012 drawdown. Therefore, in order to supplement these data needs the National Uncrewed Systems Office was asked to provide UAS-based collection during the 2016 drawdown and determine if the acquired data could generate a significantly detailed DEM. The Project Office worked with Frontier Precision Inc., a UAS data collection company located in Jerome Idaho, for collection of the high-resolution imagery during the 2016 drawdown using a Trimble UX5 equipped with RTK capabilities and a Sony ILCE-5100 camera. Once acquired, the imagery was processed using structure-from-motion techniques to generate a detailed DEM georeferenced with RTK level surveyed ground control points surveyed using an in-house (ORWSC owned) RTK-GPS running on the Oregon RTN network. This detailed DEM had a ground resolution of 12 cm, derived from a point cloud of 65 points per square meter, exceeding the requirements needed for comparison to the 2012 0.5 meter resolution DEM. The resulting ortho imagery was created at a 3 cm ground sample distance.
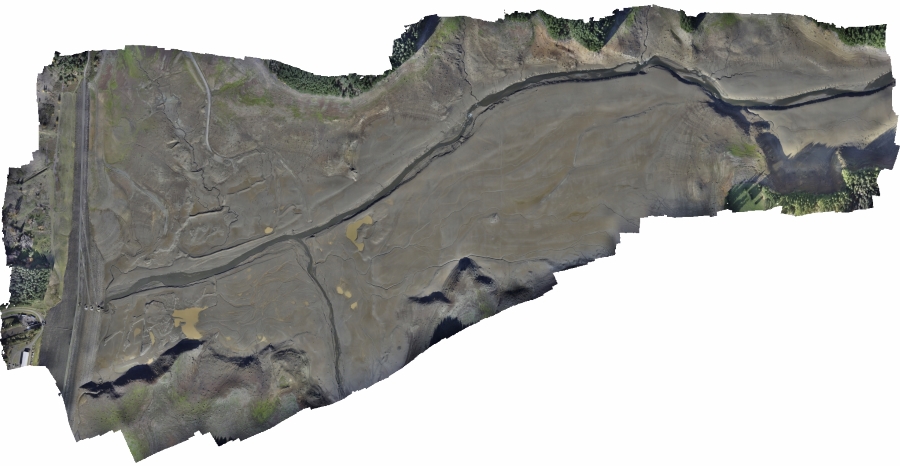
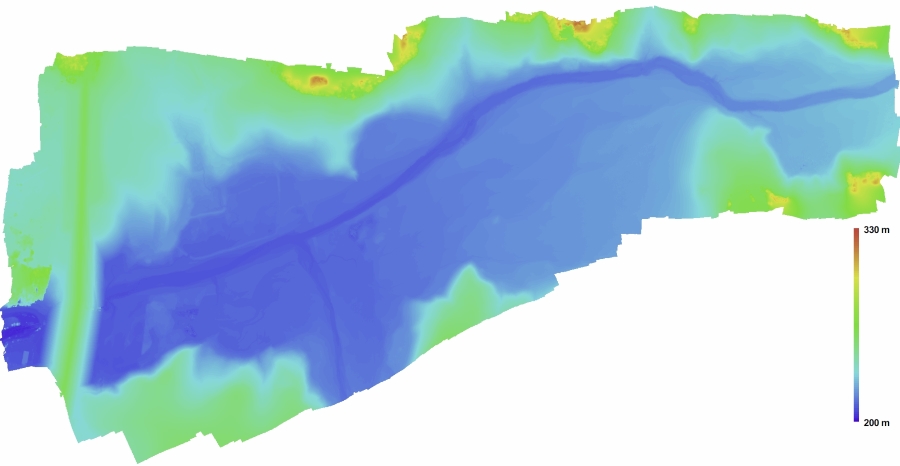
The successful UAS collection of data that more than met the high-resolution requirements provided a potential low-cost solution to support the type of DEM differencing needed for the continued monitoring of the site. In addition, the ability to use this technology to generate repeat DEMs of the reservoir bathymetry during the annual drawdown presents a unique opportunity to develop and refine this technology for use in other reservoir management and dam removal studies. A UAS-based approach also avoids the challenges encountered by researchers at previous project sites (i.e. reservoir size, timing of release, cost for LiDAR, difficult or unsafe ground conditions).
Study Points of Contact:
Joseph Mangano, Hydrologist
USGS Oregon Water Science Center
jmangano@usgs.gov
Mackenzie Keith, Hydrologist
USGS Oregon Water Science Center
mkeith@usgs.gov
Utilizing UAS for Data Collection at Remote Sites
Palmyra Atoll National Wildlife Refuge
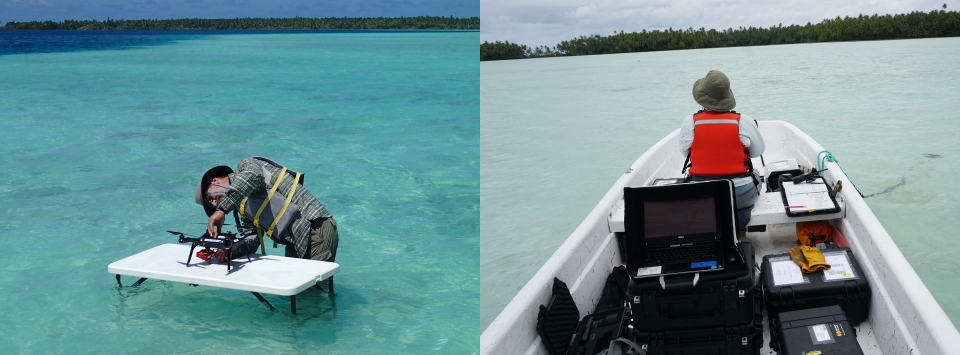
Although previous research has demonstrated the utility of various remote sensing instruments to aid in the understanding of key biophysical properties associated with ecosystem process, climate change, and hydrology of the Palmyra Atoll, data collection efforts are often hindered by both logistical and cost prohibitive factors. For instance, image data collected by tethered balloons and kites on Palmyra can be limited by wind direction, and although high resolution multi-spectral and hyperspectral data are available through satellite or manned aerial flight, they are often cost prohibitive. In an effort to addresses some of these challenges, Palmyra Atoll researchers asked the USGS to evaluate the effectiveness of using on-site small UAS data collection platforms to acquire high resolution images and collect associated data to benefit the science conducted on Palmyra.
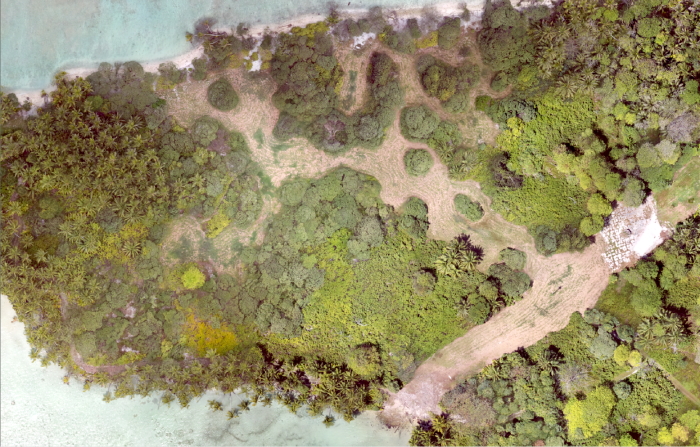
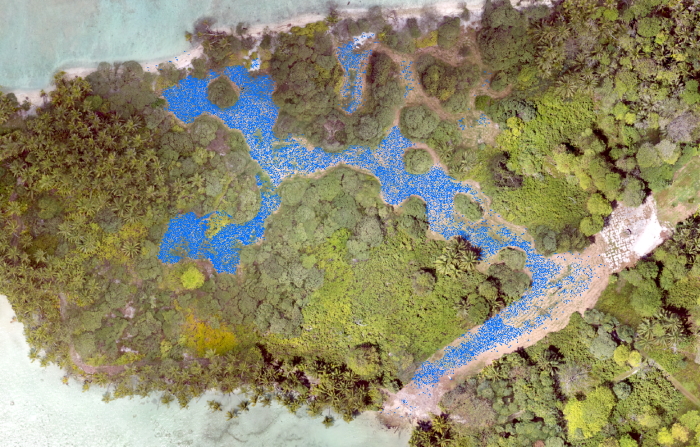
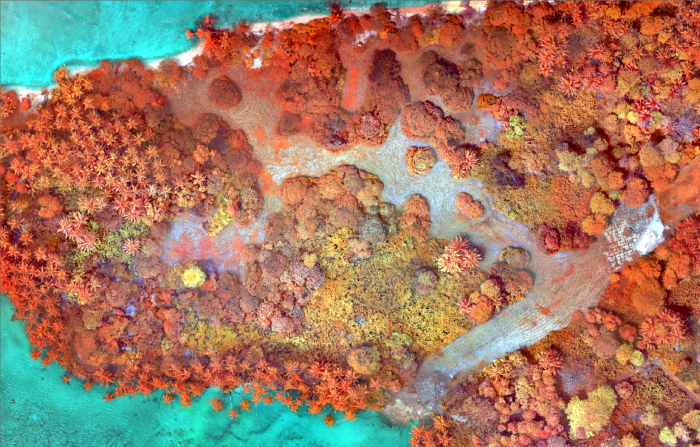
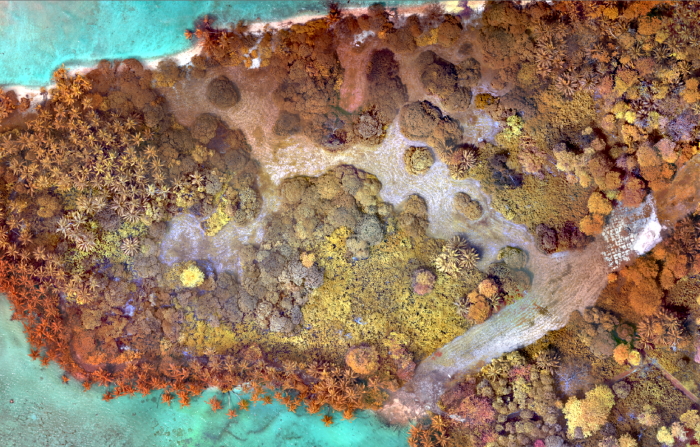
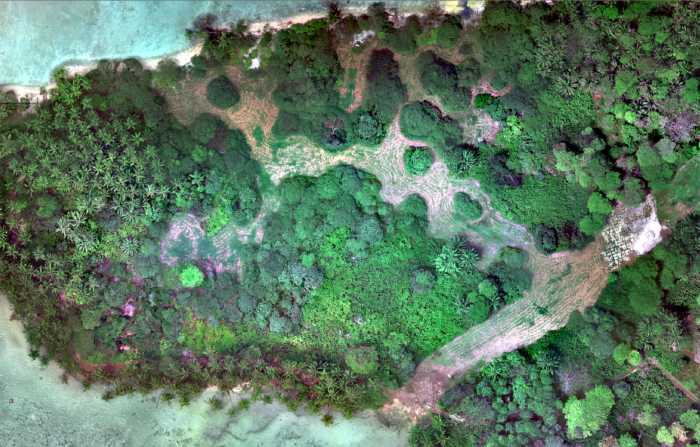
UAS data collection applications for Palmyra included collecting video, high resolution natural color, multi-spectral and thermal images. Associated GPS ground locations and ground-truth information was gathered during aerial surveys including areas of emerging land (forest), lagoons, reef, and surf zones. Wildlife species targeted for observation included the many and wide ranging species of birds on the Atoll, turtles, mantas, sharks, coral, and corallimorph. The USGS UAS equipped with still frame and video cameras added the ability to fly slowly over the lagoon or hover over targeted areas of interest with increased manuerverability without being impacted by cloud cover, wind, canopy cover, or other natural aerial data collection obstructions.
The high resolution images and associated data collected on the Palmyra Atoll can be useful to better understand turtle population dynamics and behavior, lagoon flows, bird populations, corallimorph areas, and many other related studies. Near infrared and thermal sensor data, which can be validated with the collected color video imagery, will provide a cost-effective opportunity to research and further develop techniques to measure biophysical and ecosystem properties. The high resolution imagery from the sUAS' also provides unique opportunities to correlate ground measurements which will improve the hydrologic, thermal, and landscape assessments of aquatic wildlife, atoll vegetation, hydrologic changes and bird habitat and behavior. Most importantly however, the proof-of-concept flights allow scientists to realistically examine the use of UAS capabilities on the remote atoll with the goal being to keep aerial data collection platforms permanently on site for immediate and practical use by the visiting scientists.
Carl Orazio, Physical Scientist
USGS Columbia Environmental Research Center
corazio@usgs.gov
3D Modeling
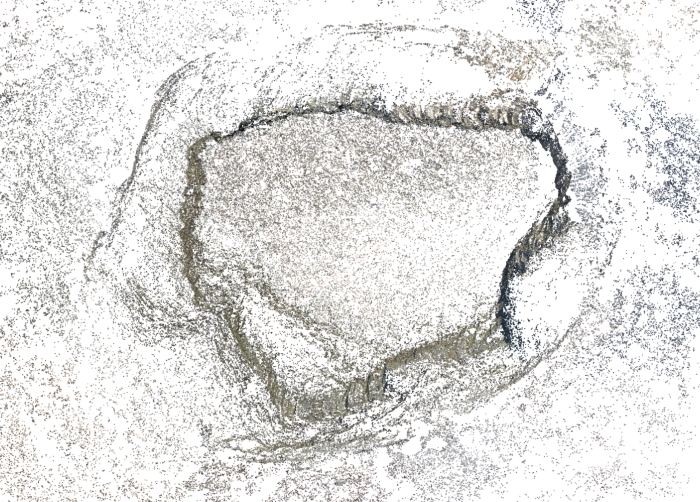
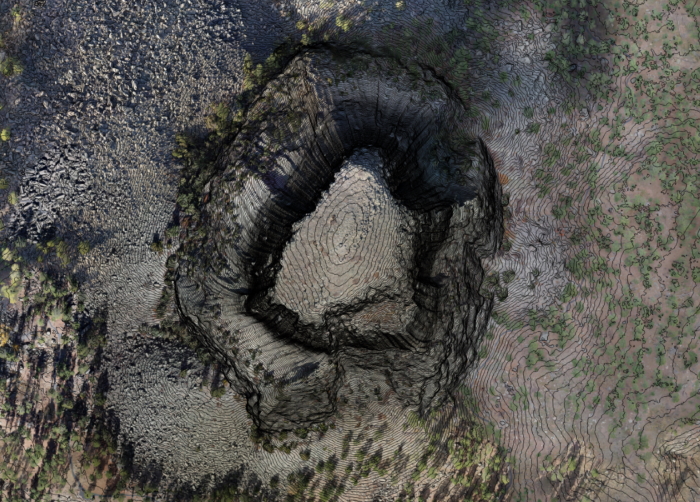
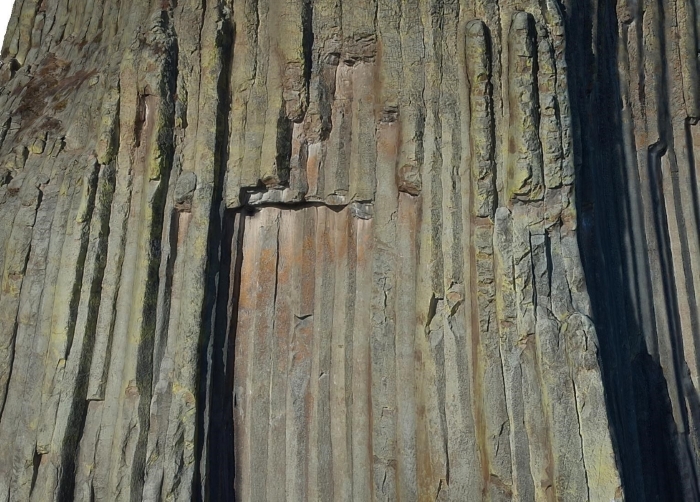
Devils Tower National Monument in Wyoming
Devils Tower rises 867 feet above the surrounding landscape, and is a prominent monolith of igneous rock. The tower is the monument’s primary resource, as identified in its enabling legislation, yet its vertical aspects and summit can only be seen by those with technical rock climbing experience. High resolution imaging allow the park staff to discern fine details of the tower surface, including erosional cracks, and provide a snapshot-in-time document of rock quality conditions. This dataset is used as a baseline to evaluate potential rock fall areas of concern. The digital 3D model also allows the park to display climbing routes, pre-plan for rescue operations, and examine nesting sites commonly used by peregrine falcons.
In October 2016, the USGS and the NPS set out to collect the high resolution imagery required to generate the 3D digital dataset of the tower. Prior to the actual flights, NPS personnel climbed the tower to place several ground-control targets and conducted ground-truth surveys of ground texture and vegetation. The UAS flights were conducted with a 3DR Robotics Solo quadcopter utilizing a Ricoh GR II camera payload. Sections of the viewing trail were closed for public safety while UAS flights were conducted. Twenty flights, over a three-day period, yielded more than 2,000 overlapping photos. The data was processed using photogrammetry (structure-from-motion) algorithms with surveyed ground control targets and scale markers to georeference the model in three dimensions.
Study Point of Contact:
Rene Ohms, National Park Service Coordinator
Devils Tower, Wyoming
rene_ohms@nps.gov
Examining Harmful Algal Blooms
Lake Milford near Manhattan, Kansas
USGS hydrologists from the Indiana-Kentucky Water Science Center, the Kansas Water Science Center, and the USGS National Uncrewed Systems Office conducted data acquisition flights at Lake Milford near Manhattan, Kansas on Sept. 13-14, 2016 looking at extents of harmful algal blooms within and around the lake. Lake Milford is the largest man-made lake in Kansas with 15,700 acres of water. This lake has well-documented issues concerning harmful algal blooms occurring throughout the summer months. The 3DR Solo quadcopter UAS equipped with a MicaSense RedEdge multi-spectral camera, a Ricoh GR2 digital camera and a GoPro Hero 4, was used to fly portions of the northernmost portion of the lake, as well as a surrounding wetland area. Algal blooms were visibly identified through the natural color and video data collection over several sections of the lake. However, the multi-spectral data that was collected over the lake edges were most useful for allowing scientists to identify numerous areas of harmful algal bloom concentrations not clearly seen by the human eye or in the natural color and video images specifically due to turbidity from recent rainfall. The proof-of-concept data acquisition provided information to the scientists about the use of UAS for identifying the algal bloom and possibilities for rapidly mapping extents and near real-time monitoring.
Study Point of Contact:Jennifer Graham, Hydrologist
USGS Kansas Water Science Center
jlgraham@usgs.gov
Evaluate Bottomland Restoration Efforts
Northeast Indiana
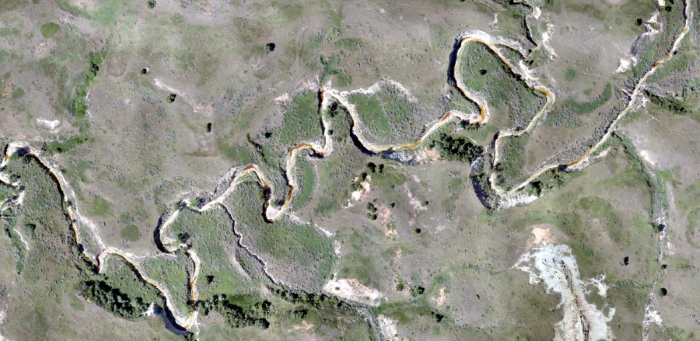
The success of efforts in the Midwest to restore various bottomland sites to hardwood forests often depends on the ability to rapidly monitor individual planted tree stems to assess mortality and success levels according to modeled and measured abiotic factors. Aerial data can be used to assess the progress of the tree stems for bottomland restoration. The advent of UAS technology to collect very high resolution aerial data illustrates a method to efficiently and affordably monitor the success of the restoration efforts.
In September 2016, the USGS Columbia Environmental Research Center, the Indiana-Kentucky Water Science Center and the UAS National Project Office flew a UAS project in northeastern Indiana near the town of Ft. Wayne to acquire high-resolution natural color and multispectral imagery. The aerial data was used to combine with specific individual tree stem mapping data in order to detect the species’ responses to events as it related to the depth and duration of flooding on various soil types. Image data from a MicaSense RedEdge multi-channel sensor mounted on a 3DR Solo UAS was used to generate near-infrared images with 10 cm resolution and 0.25 meter horizontal spatial accuracy to enable identification of individual tree stems and assessment of tree status — dead or alive. Natural color imagery acquired with the Ricoh GR camera (16 megapixel) added even higher resolution data for use in individual tree identification. Using these combined datasets allows for the enhancement of flood mapping and ground-water and soil moisture indices, that can relate to local stage information derived from ground- and surface-water monitoring wells and soil moisture piezometers installed on site.
Images collected and process with structure-from-motion techniques, allowed for the creation of geospatial products to compare to estimates of carbon-load derived from plot data to determine if photogrammetric methods are appropriate for estimating carbon sequestration on restored sites.
Study Point of Contact:
Matthew Struckhoff, Ecologist
USGS Columbia Environmental Research Center
mstruckhoff@usgs.gov
Evaluate land use impacts on sediment, salinity, and selenium distribution
Stinking Water Gulch near Rangely, Colorado
In many areas of western Colorado, the Cretaceous Mancos Shale Formation is present and a natural source of sediment, salinity, and selenium to surface waters (Presser and others, 1994; Elliott and others, 2008). As a result, one of the water quality goals of the of the Bureau of Land Management (BLM) and the Colorado River Basin Salinity Control Forum is to minimize land use actions that increase the release of stored sediment, salinity, and selenium from Mancos Shale landscapes. Meeting this goal makes understanding if and how common land uses affect channel storage, especially in Mancos Shale areas, a crucial requirement.
In an effort to evaluate the possible impacts of land use on areas of Mancos Shale in Colorado, the U.S. Geological Survey (USGS) in cooperation with the BLM used UAS to collect data over four 400-acre basins that have been subject to different types of land use. More tradition data collection methods in these areas have been challenged by erosion-sensitive ground species, and steep and unstable terrain, therefore UAS have the potential of being a more effective and less invasive method. The required high resolution image data was collected in early September of 2016 with a Ricoh GR camera mounted on a 3DR Solo platform. Once collected this data was used to generate topography mapping of each basin based on structure from motion techniques which can produce better topography of open areas with limited vegetation. Comparison of the different mappings allow for more accurately characterizing geomorphic and volumetric differences within and between the basins.
Study Point of Contact:Cory A. Williams, Hydrologist
USGS Colorado Water Science Center
cawillia@usgs.gov
Wildlife and Vegetation Surveys
Theodore Roosevelt National Park in North Dakota
The National Park Service (NPS) is responsible for preserving and managing all of the natural resources contained within the 84 million acres of the National Park System. Challenged by the size of these holdings the collection of various forms of remotely sensed data has become a crucial requirement for resource managers. Today most data collection activities are performed with traditional methods such as manned aerial surveys and satellite imagery, however there are also several known drawbacks associated with each method including considerable costs. As a result, the NPS is evaluating alternative data collection techniques including UAS technology.
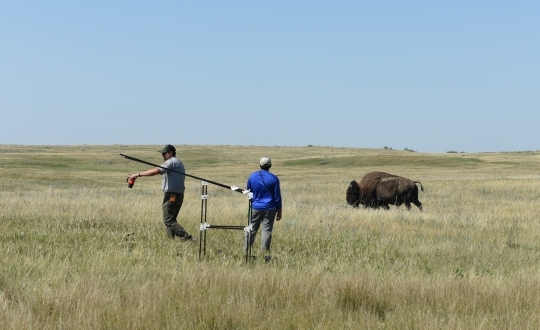
One ongoing evaluation is a joint project between USGS and the NPS in the Theodore Roosevelt National Park to evaluate the feasibility and limitations of UAS data collection by establishing cost effectiveness and quality of data products.
Three specific resource management applications within the park were used to test the effectiveness of UAS data collection:- Population surveys of large ungulates (bison, elk, and deer) which aid in development of culling strategies to optimize herd health. Specifically, UAS technology was evaluated for its ability to collect data in the complex topography of the North Dakota Badlands that contains numerous draws and canyons that provide ample areas for large ungulates to hide.
- Annual mapping of prairie dog colonies which helps track colony size dynamics over time. Determine if UAS data can accurately detect the extent of prairie dog colonies based on browse line features in graminoid and forbaceous vegetation.
- Map and identify colonization sites of invasive plant species to support eradication efforts. Evaluate the feasibility of data collected from a multispectral sensor mounted on a UAS platform for detecting invasive species within a patchwork of native vegetation.
In July 2016 the USGS, in collaboration with the NPS, performed a UAS mission utilizing the Falcon fixed wing UAS mounted with a Sony A5100 camera and a MicaSense RedEdge multispectral sensor to support these investigations. Ongoing research is being conducted utilizing this newly acquired data to determine if higher quality geospatial products can be generated cost-effectively when compared to those produced with data acquired with traditional survey methods.
Study Points of Contact:Todd Preston, Geologist
USGS Northern Rocky Mountain Science Center
tmpreston@usgs.gov
Blake McCann, NPS Wildlife Resource Manager
Theodore Roosevelt National Park
blake_mccann@nps.gov
Earthquake Fault Surveys
Borah Peak in Idaho
In 1983, about 40 kilometers of the Lost River Fault zone ruptured, generating the magnitude 7.3 Borah Peak earthquake. Understanding the fault-rupture processes of the Borah Peak Earthquake (e.g., the magnitude and extent of surface deformation) is important to modeling the energy release of future earthquakes and improving seismic-hazard characterizations such as the USGS National Seismic Hazard Maps.
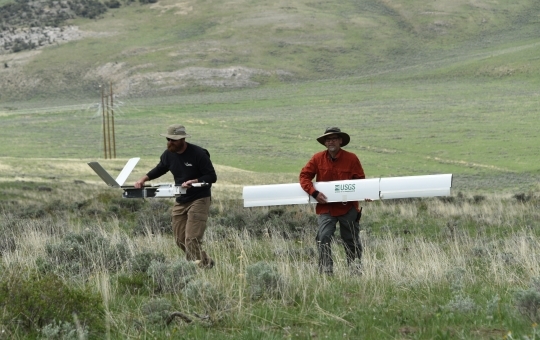
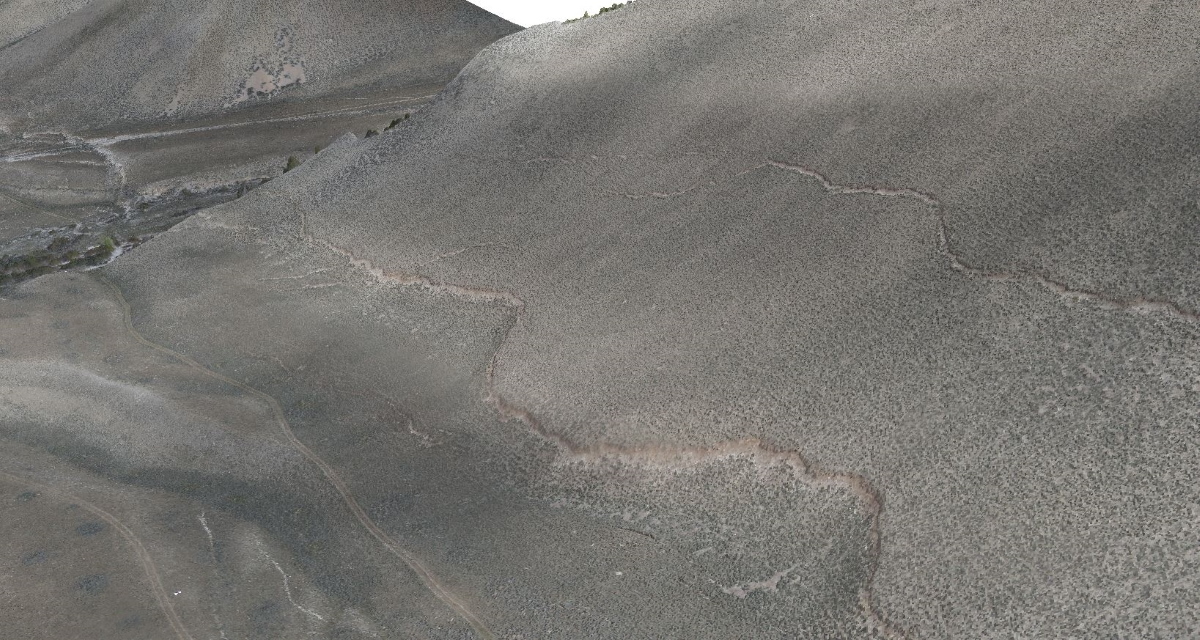
In May 2016 a collaborative project between the USGS Geologic Hazards Science Center (GHSC) and National Uncrewed Systems Office (NUSO), utilized the Falcon fixed wing UAS to acquire high resolution aerial photography for selected areas of the Borah Peak fault rupture that already had available aerial LIDAR data. After the data was successfully acquired, structure-from-motion derived point clouds were generated to conduct a point cloud comparison and accuracy analysis against historic LiDAR data.
Comparison of these structure-from-motion derived point clouds with airborne LIDAR of the Borah Peak earthquake rupture will help facilitate workflows for vertical and lateral displacement measurements, and highlight the benefits and limitations of each technology. These products aid in the survey's understanding of the fault rupture process and are important to modeling the energy release of future earthquakes.
Study Point of Contact:
Christopher DuRoss, Research Geologist
USGS Geologic Hazards Science Center
cduross@usgs.gov
Monitoring Land Surface Change
West Fork Mine near Bunker, Missouri
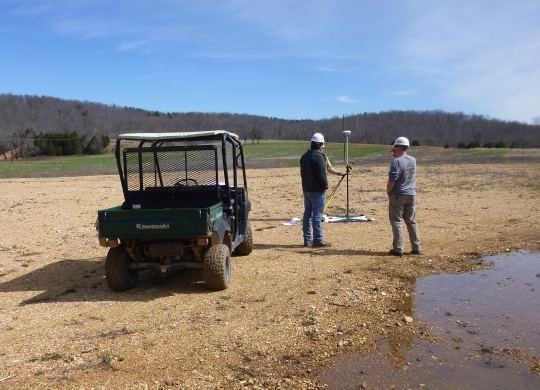
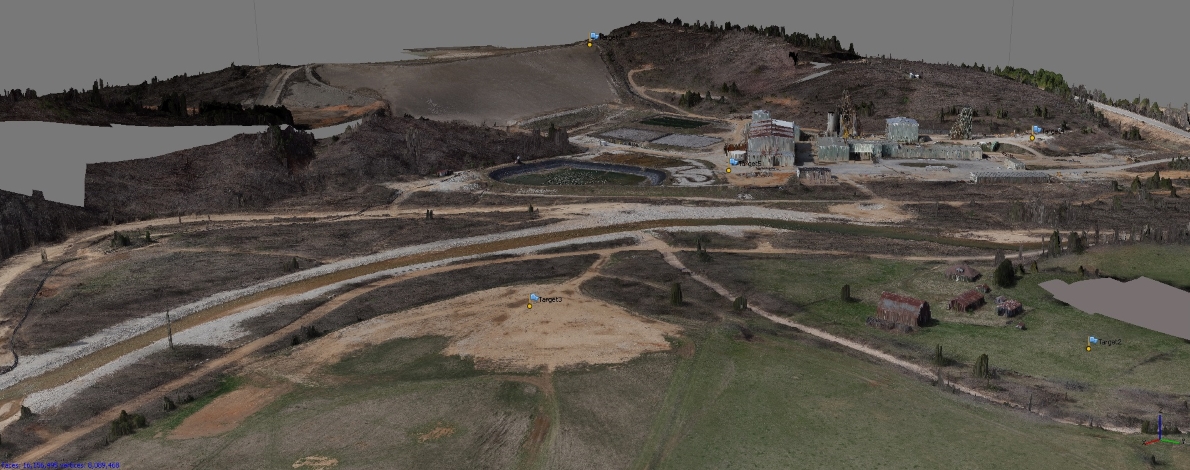
The West Fork mine is an underground lead-zinc mine that has been experiencing the formation of sinkholes and cracks in the land surface since a partial mine roof collapse occurred in 2014. As a result of these land surface changes there is a concern that the general area is unstable and a risk of failure of the main tailings pond dam exists which could expose the West Fork of the Black River to a large volume of heavy metal laden mine tailings and could cause environmental damage for some distance downstream from the site. Following the roof collapse the Missouri Department of Natural Resources, who had already visually identified and marked numerous ground cracks in the main tailings pond dam, requested that the USGS assist them in identifying ground movement over time by conducting detailed ground-based LiDAR scans of the area. However, USGS determined that ground-based LiDAR scanning was unfeasible since the area was closed to vehicular traffic and potentially risky to both instrumentation and personnel because of ground instability. But in April of 2016 USGS successfully coordinated the UAS collection of this much needed high-resolution image and elevation data by 417 Drone Imaging, a UAS data collection company in Springfield Missouri, without needlessly risking personnel and equipment in a potentially unstable area.
Once successfully collected this high-resolution color imagery (approximately 5-10 cm pixel size) and elevation data (in the 6-10 centimeter vertical and 2-4 centimeter horizontal resolution range) was used to produce various geospatial products to support ongoing monitoring efforts. Elevation source data was used to develop a baseline surface that can be used to monitor land surface changes particularly on and near the tailings dam face and over the known sinkhole areas. Elevation and leaf-off imagery data will allow for the identification of any additional sinkholes that may have appeared in agricultural pastures across the West Fork or in any of the wooded areas surrounding the mine site.
If required, future UAS data collection efforts could focus on thermal scans, particularly of the river channel, so that locations of groundwater discharge into the river could potentially be revealed.
Study Point of Contact:
Joseph Richards, Hydrologist
USGS Missouri Water Science Center
richards@usgs.gov
Rapid-response: Mapping Coastal Change
Cape Cod National Seashore in Massachusetts
The Coastal and Marine Geology Program conducts research to monitor and assess coastal hazards and changes in landscape, land use, and ecosystems. This research includes mapping of offshore and coastal bathymetry, topography, geology, and habitat. Coastal hazards are assessed using these data with statistical and process-based models.
Coastal change is episodic. Significant changes in the beach and nearshore regions; erosion of dunes, bluffs, and cliffs; overwash; inlet formation; and changes in habitat occur in a matter of hours during storms. Major geomorphic changes occur with (at best) 24 to 48 hours advance notice, often after long periods of relatively slow change.
Prediction of storm impact in coastal regions requires accurate and up-to-date maps of coastal morphology on land (bluff or dune height, beach slope and width) and in the water (nearshore bars and shoals, offshore bathymetry). Evaluation of geomorphic response models requires accurate maps of the same features immediately after the events, before anthropogenic or natural fairweather processes modify the storm-related changes. Thus, the ability to map before and after infrequent but significant events is critically important.
Structure-from-motion (sfm) is a new but proven technique for making high-resolution maps from multiple photographic images. Unmanned aerial systems (UAS) provide the ability to acquire these images and map coastal features quickly, safely, and inexpensively, on short notice and with minimal impact. By contrast, lidar surveys of coastal regions are infrequent and costly: the most recent measurements on Cape Cod were obtained in 2011, and logistics prevented timely mapping after the series of winter storms that occurred in January and February 2015.
On March 1, a long permitting and planning process was consummated with two UAS flights to map Coast Guard Beach in Cape Cod National Seashore. The flights were flown by Raptor Maps, Inc., a startup firm from the Boston area, under a contract arranged by Bruce Quirk and Jeff Sloan of the USGS UAS program located in Denver. The project was a proof-of-concept exercise to demonstrate that UAS operations could be safely, legally, and effectively used to make maps of coastal features. The project was supported by the USGS Innovation Center for Earth Sciences and two ongoing CMGP projects.
Study Point of Contact:
Christopher R. Sherwood, Research Oceanographer
Woods Hole Science Center
csherwood@usgs.gov